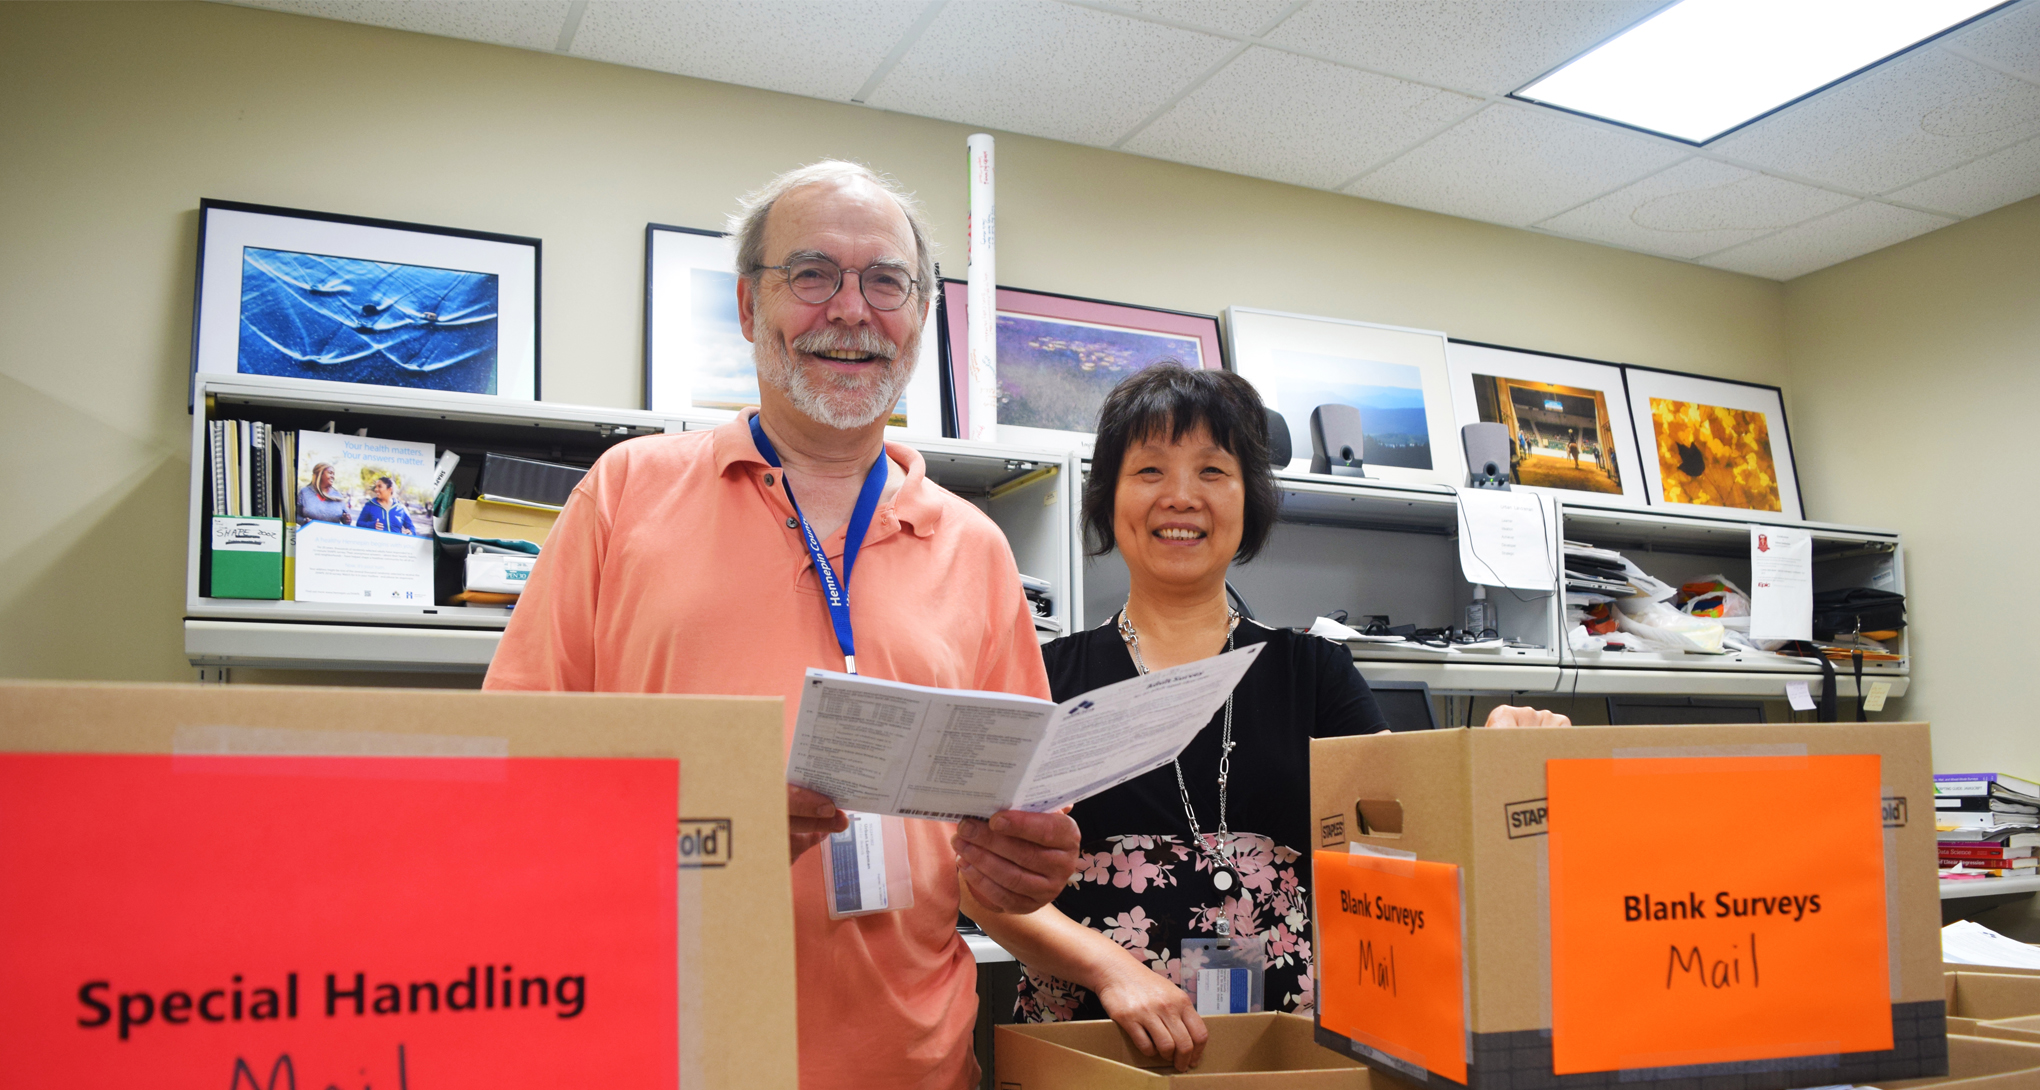
Urban Landreman and Mei Ding spend their days analyzing data. And they do it from a windowless office in the basement of Hennepin County’s Health Services Building.
The thought of that makes us want to pull out our hair, but the two self-described “data nerds” wouldn’t have it any other way.
“People keep asking me why I’m not retired and I say, ‘because data is really fun,”’ the bespectacled Landreman says. “It an addiction [for him],” Ding adds, laughing.
Landreman and Ding’s work revolves around SHAPE, a health survey that Hennepin County conducts every four years with randomly selected households. The survey asks residents anonymous, confidential questions about their health, diet, exercise, lifestyle, and ability to get health care.
Urban LandremanPeople keep asking me why I’m not retired and I say ‘because data is really fun,’
Number of
Hennepin County
households that
will receive a
SHAPE survey
in 2018
Landreman and Ding, along with others on the SHAPE team, use residents’ answers to create a comprehensive overview of the unique health issues facing the county’s diverse population.
That overview is then used by local entities — like government, nonprofits, and health care organizations – to see how Hennepin County compares to other municipalities, to track health trends over time (e.g., Hennepin County’s smoking rate among adults 25 and older declined nine percent between 1998 and 2012), and to shape planning, programming, and policy development work.
SHAPE is now in its twentieth year and Landreman and Ding have been there for all six iterations. “Every single one,” Landreman says with a smile.
Although there’s existing health data out there like birth and death records, the SHAPE survey is unique because it asks questions that other sources don’t.
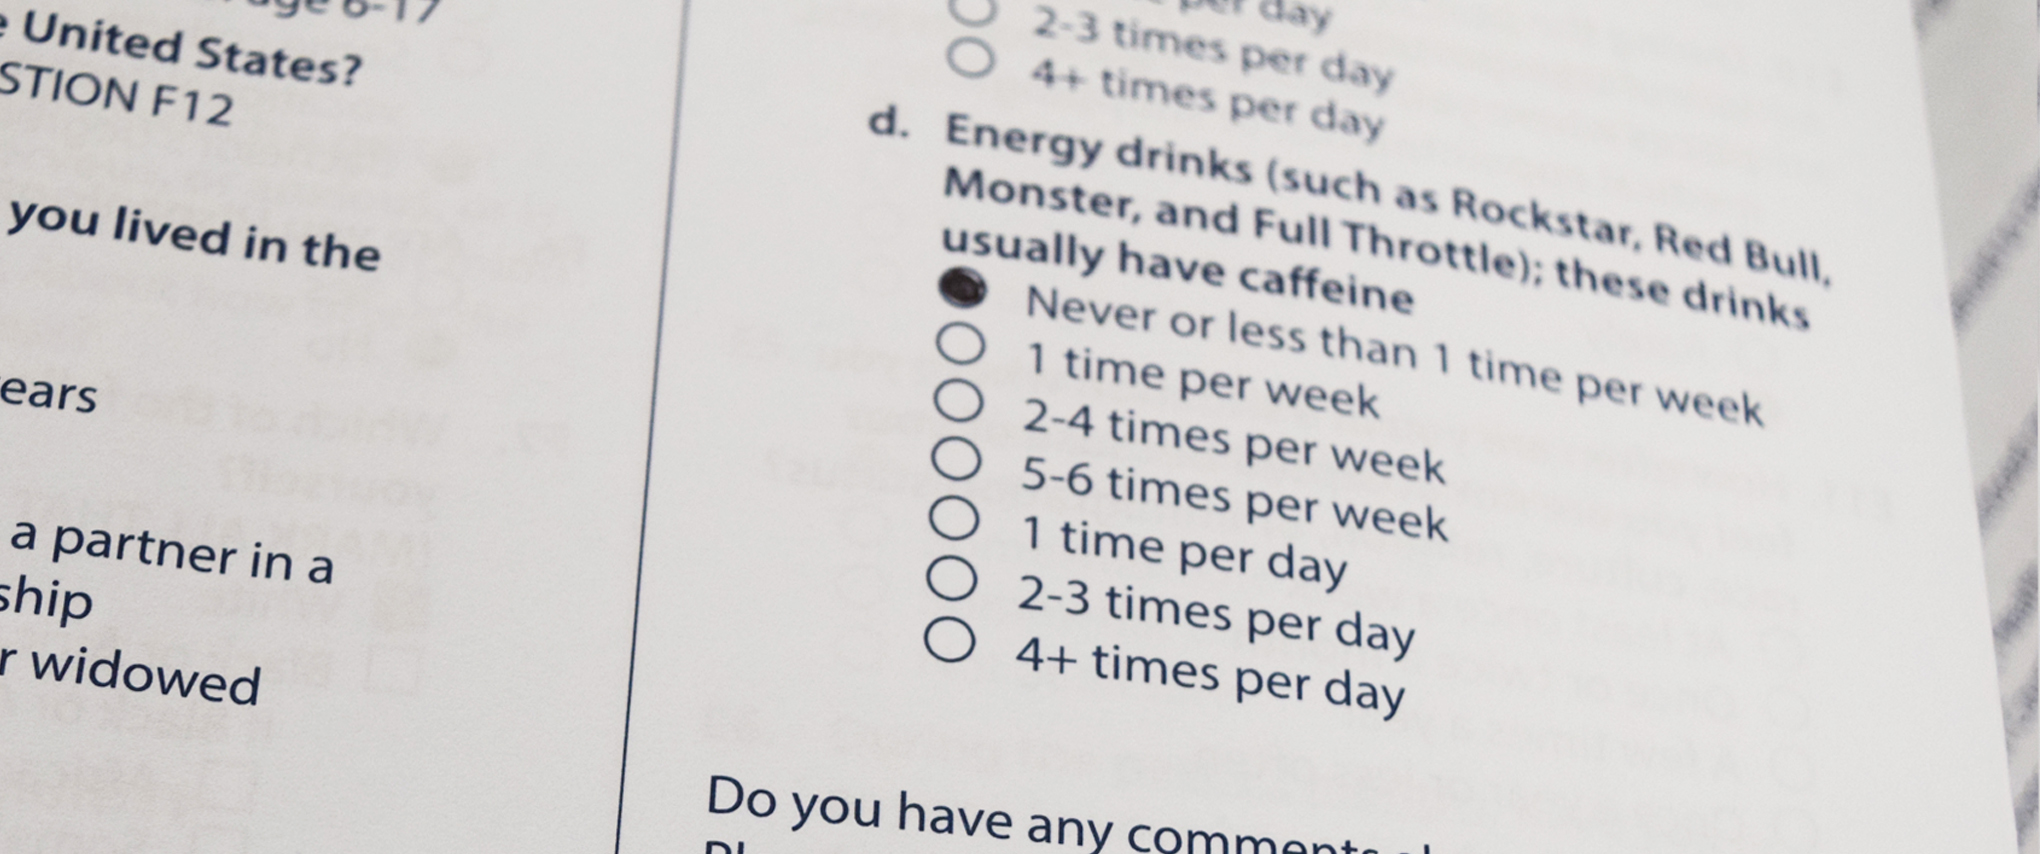
For example, SHAPE’s behavioral questions like, “How many servings of vegetables did you have yesterday?” or “Do you smoke cigarettes every day, some days, or not at all?” capture lifestyle and chronic disease risk factors.
And SHAPE’s social and environmental questions, like, “In the past 12 months, how often did you worry that your food would run out before you had money to buy more?” or “How safe from crime do you consider this neighborhood to be?” capture how people are faring within specific geographic areas of the county.
The answers have revealed what public health entities all over the country are realizing – that things like household income, education, employment, and the neighborhood in which you live (aka., the social determinants of health) significantly affect health outcomes.
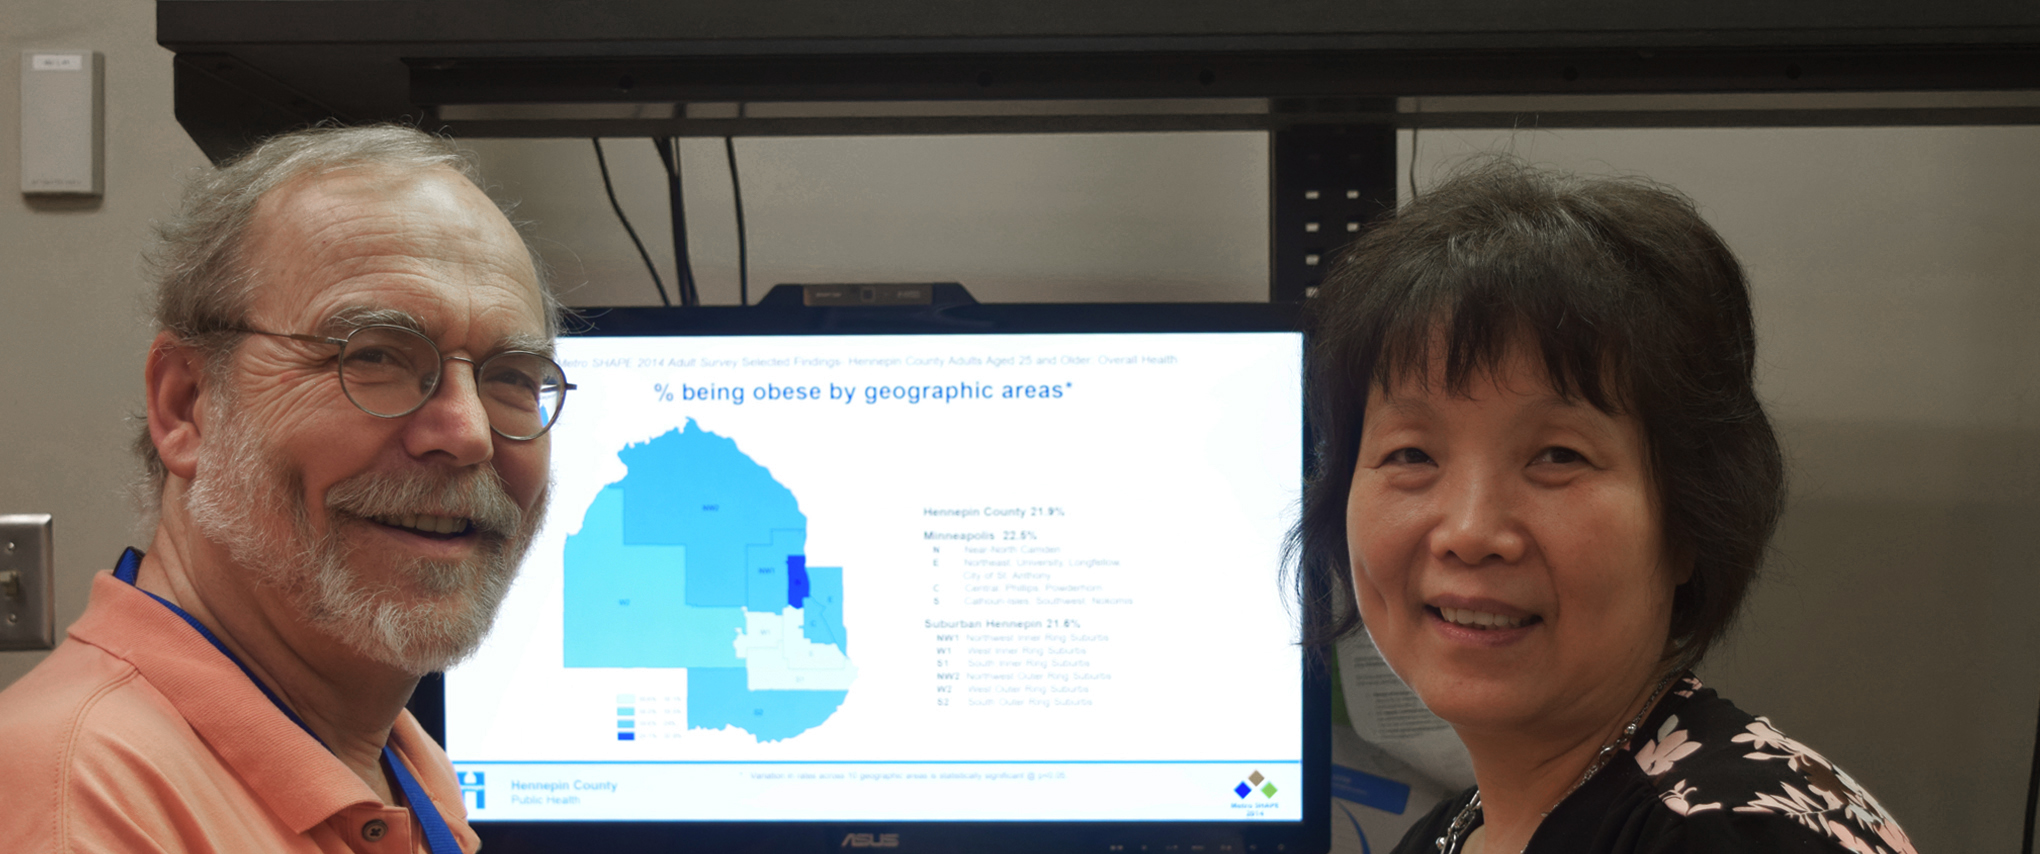
SHAPE data clearly shows that people who belong to specific demographics or who live in specific geographic areas of Hennepin County are negatively impacted by persistent health disparities. And for 20 years, Hennepin County entities have used the data to target upstream prevention efforts at the populations and areas that show these disparities.
For example, SHAPE has identified populations (like people who live in multi-unit housing) that are disproportionately impacted by tobacco, and helped target smoke-free policies and tobacco cessation support efforts.
And SHAPE has also identified geographic areas within Hennepin County where residents report low consumption of fruits and vegetables, and helped expand people’s access to healthy, nutritious food in these areas via farmer’s markets, food shelves, and more.
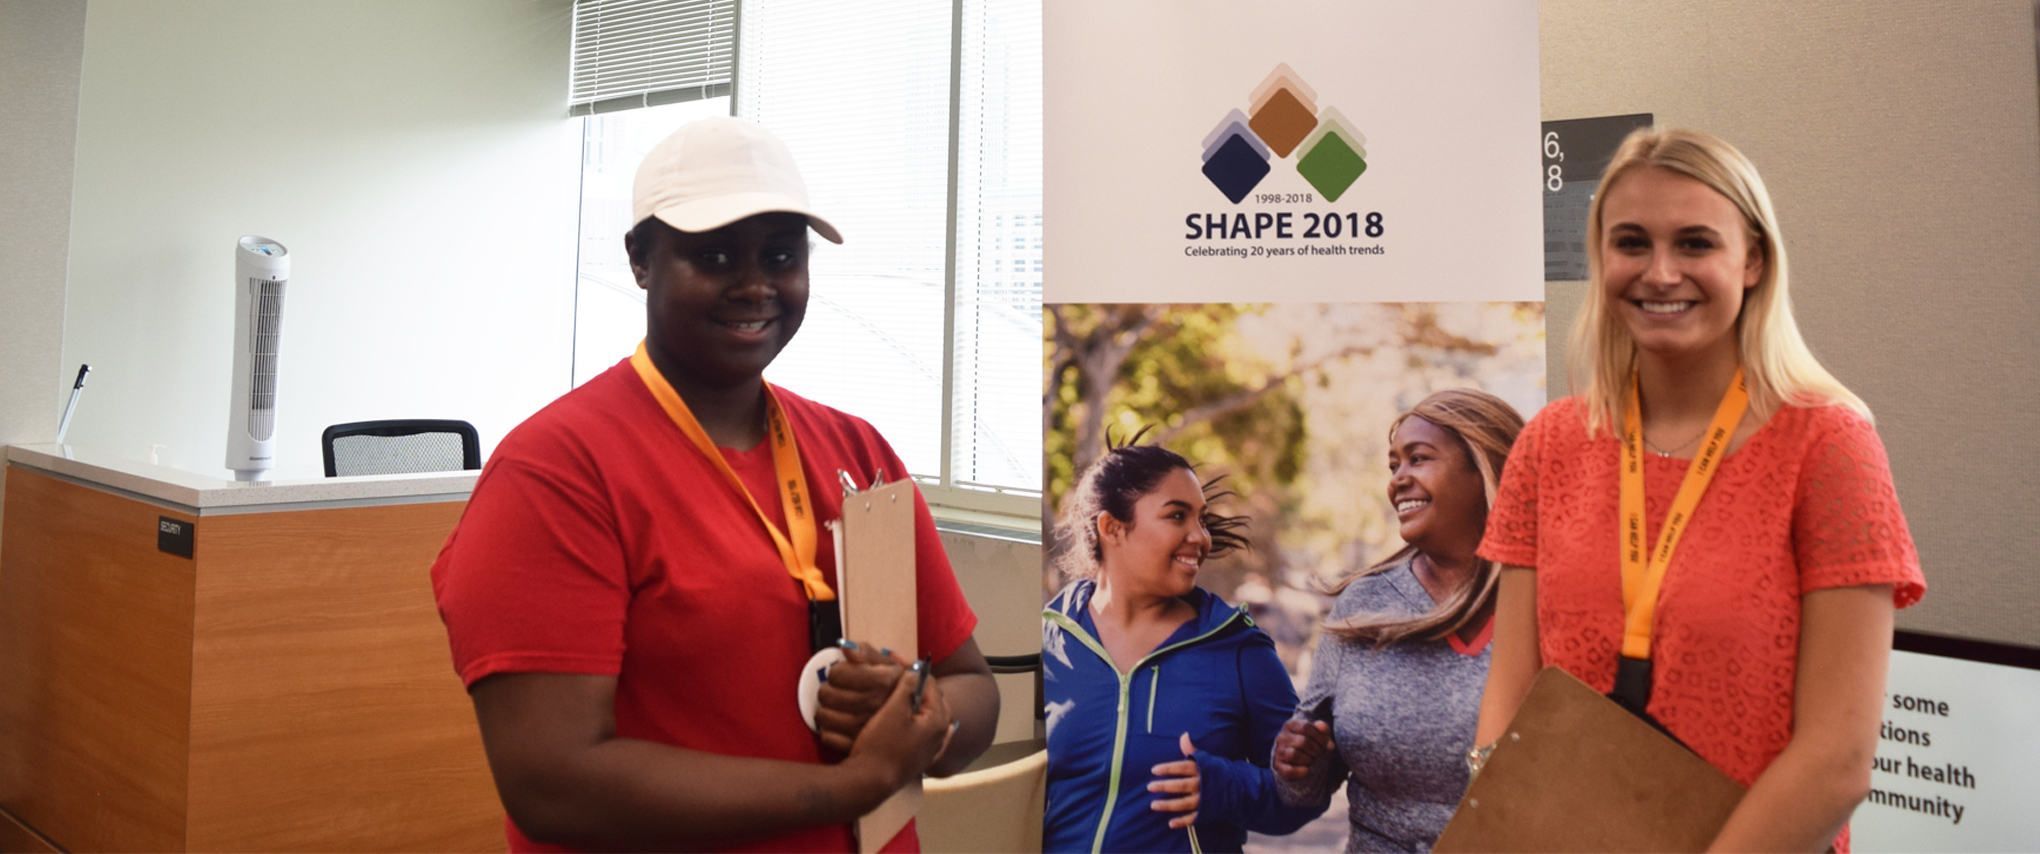
As SHAPE embarks on its sixth iteration in 2018, the team is trying new things.
For instance, in addition to the mailed survey sent to 40,000 households, they’ve started inviting residents seeking services at the Hennepin County regional human service centers and NorthPoint Health and Wellness Center to take the survey while waiting for their appointments. And they’ve bulked up their language translation services, too.
“The hard to reach are getting harder to reach,” Ding says to explain why SHAPE is making these changes.
“If you don’t speak English very well, trust the government, or feel like you’re part of the community, you’re less likely to fill out the survey,” Landreman adds. “We’re really trying to make sure that we survey people from the whole spectrum of the county.”
“Collecting this information is among the best ways for us to make progress toward becoming a health community,” says Susan Palchick, Hennepin County Public Health director. “Anyone who receives the survey in the mail, or who is invited to take it in-person, is encouraged to take the time to respond to the questions.”
To learn more about SHAPE and to review the results from previous surveys, go to www.hennepin.us/shape
Written by: Lori Imsdahl